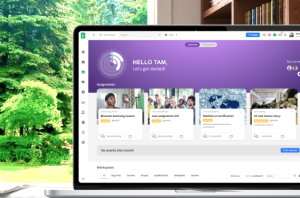
Blossom helps make workforce learning and performance data more visual, meaningful and actionable. Simplifying the creation of informed plans and strategies for your organisation in one place, and more personalised to individual user needs.
ANALYTICS AND REPORTING
Customisable Reports, Dashboards & Insights
ANALYTICS & BI
Actionable data insights at your fingertips
Guide your organisation towards better, data-driven performance and results with a panoramic view of user insights and analytics – easy to understand and share by everyone.
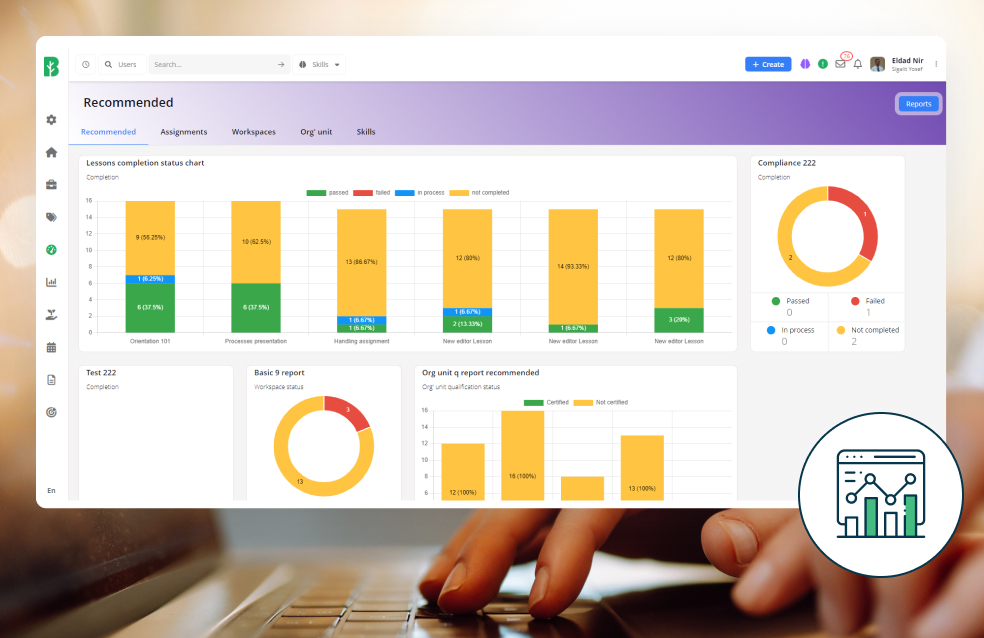
Improve engagement & understanding
Simple data visualisations help individuals track personal progress, and make it easy for managers to get an overview of team performance, keep an eye on compliance, improve feedback and coaching effectiveness, measure and prove impact, and more!
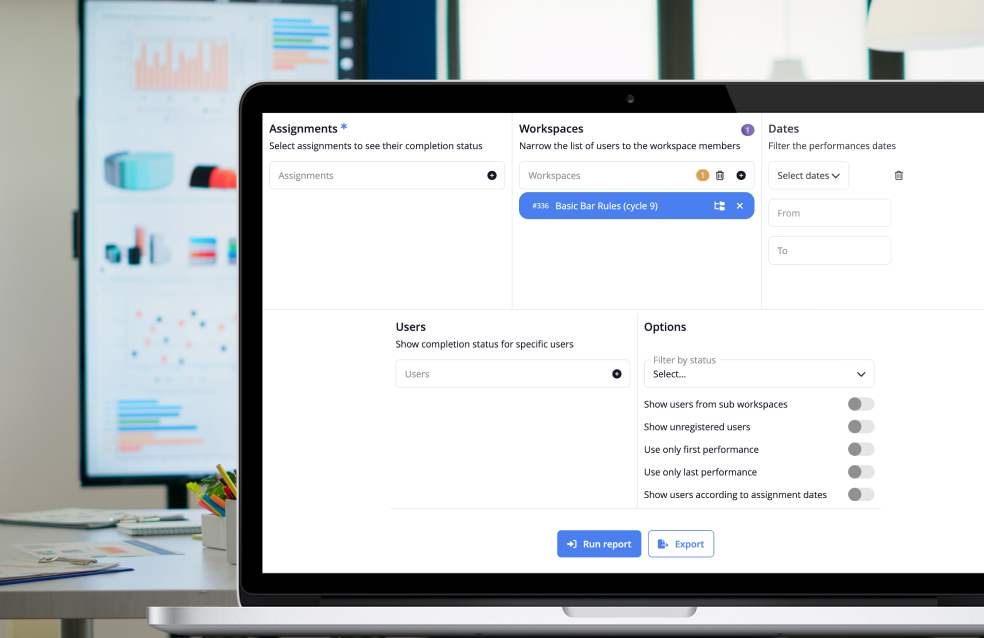
Build customised dashboards and reports
Use advanced filtering options that help you explore the finer details and uncover hidden insights, and customise reports to reflect work processes, goals and yearly work cycles.
Understand the big picture
Get a complete view of user activities segmented in a variety of different ways and gain insights on performance from multiple perspectives by combining data from multiple sources to bring all your key BI in one place.

Simplify annual budgeting and reporting
Benchmark achievements to help calculate ROI and make educated decisions. And communicate data and insights faster, with the ability to share with users on an individual, role, responsibility, team or location basis.
CHARTS, DASHBOARDS & REPORTS
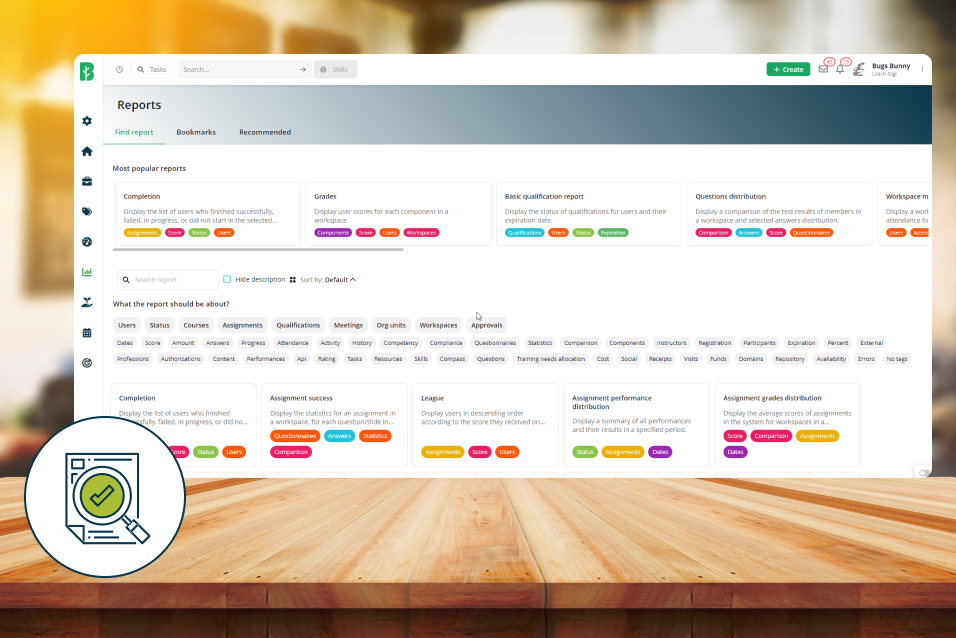
Over 100 in-built reports to choose from
Let the data tell the story and choose from an in-built library of reports.
Easy-to-understand, quick-to-digest data is only a few clicks away.
Blossom gives you all the information you need on the who, what, when and how – so you can draw insights and make informed decisions to help your people and business grow, faster.
Get quick access to key insights
-
Learning Management
A series of reports that help you better understand users’ learning & skills development and elearning course progress.
Popular reports include:
- Completion – view users’ completion status for specific courses/assignments
- Courses registration – view the status of all requests awaiting approval
- Survey – view quiz/survey/evaluation results responses
- Compliance report
-
Knowledge Sharing & Engagement
Understand which content is gaining most traction and having the best impact on users, across teams and workspaces, both internal and external to your organisation.
Popular reports include:
- Online content usage
- Shared content usage – see what the most popular shared content is among users
- Shared content completion
- League – leaderboards that display users according to the scores they received on assignments
-
Qualifications & Certifications
Popular reports include:
- Basic qualification report – explore users’ qualification status and expiration dates
- Qualification components
- Qualification dependencies
- Qualification progressions
- Past performances of qualifications
-
Training Campus
All the insights you need on training requirements, bookings, attendance and trainer feedback.
Popular reports include:
- Training needs requests
- Ratings report (Instructor) – insights on how different instructors are rated by attendees
- Instructors – view the number of hours and meetings each instructor has delivered within a specified period
-
Performance, Competencies & Careers
Popular reports include:
- User performance log
- Evaluation survey statistics
- Questions distribution & success
- Lateral questions grading
-
Teams, Tasks & Project Management
Popular reports include:
- Tasks activity and status
- Job authorisation status
- Participation planning
- Meetings attendance
-
E-commerce & Extended Enterprise
Popular reports include:
- Expenses status reports – displays expense receipts submitted by users for external events
- External event registration
- Workspace meetings schedule and attendance
Blossom’s top 10 most used system reports
Completion report
User status report
User performances report
Course grades report
Meetings schedule report
Questions distribution report
User performances log
Basic Qualifications report
User meetings report
Workspace status report
Blossom Analytics & Reporting FAQs
Answers to some common questions our team get asked about Blossom dashboards, analytics, and reports.
Got other questions you need answering?
-
How customisable are Blossom’s in-built reports?
Most of Blossom’s reports are completely customisable, allowing users to add descriptive fields (including customised fields) to one or more objects. For example, Users can choose which default fields, they want to see in system reports.
-
Can I share my own personal filtered and customised report with other users?
Yes, you can share any reports you create with any other system users.
Customised reports can also be shared with other users as templates. For example, system users/admins can create customised management reports that populate with the data specific to the user viewing the report.
-
Can I automate reports to run periodically?
Yes, using Blossom’s notification settings you can add notifications to reports that will automatically send a link to the specified users, roles or groups at set intervals.
-
Can Blossom users create their own personal dashboards?
Yes, any user with managerial role in Blossom can create personal reports dashboards. Dashboards can be customised by the users to position and display reports and graphics using a simple drag & drop editor.

